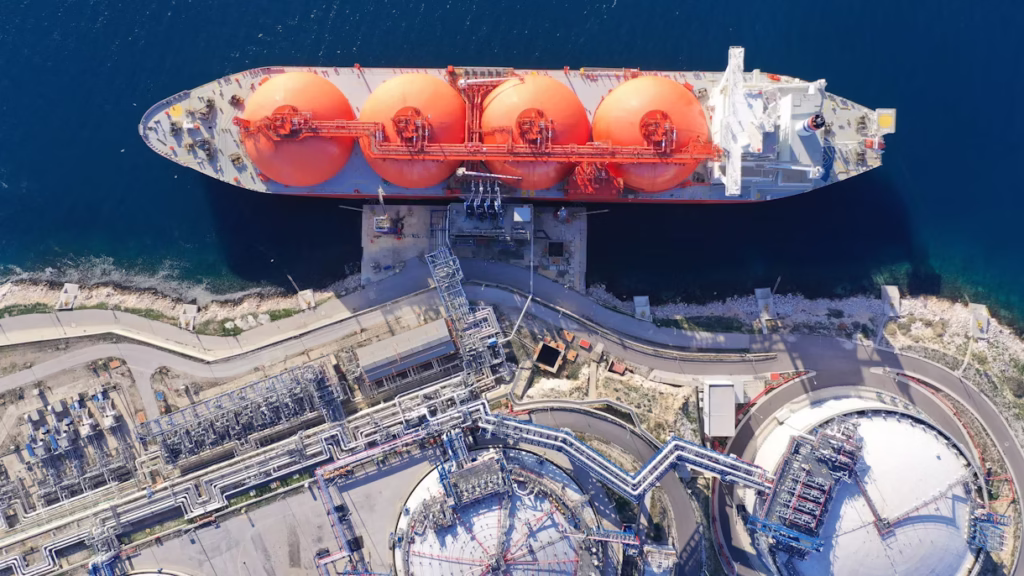
The Global LNG Capacity Tracker, developed by the International Energy Agency (IEA), is a new digital tool that offers a deep look into the future of natural gas. Designed to follow the progress of liquefied natural gas (LNG) export facilities around the world, this tracker is a key resource for understanding how global energy markets are shifting.
As countries seek to balance energy demand with climate goals, natural gas remains a key transitional fuel. The IEA’s tracker is launching at a critical time—when the world is preparing for the largest-ever wave of new LNG capacity to enter the market.
What Is the Global LNG Capacity Tracker?
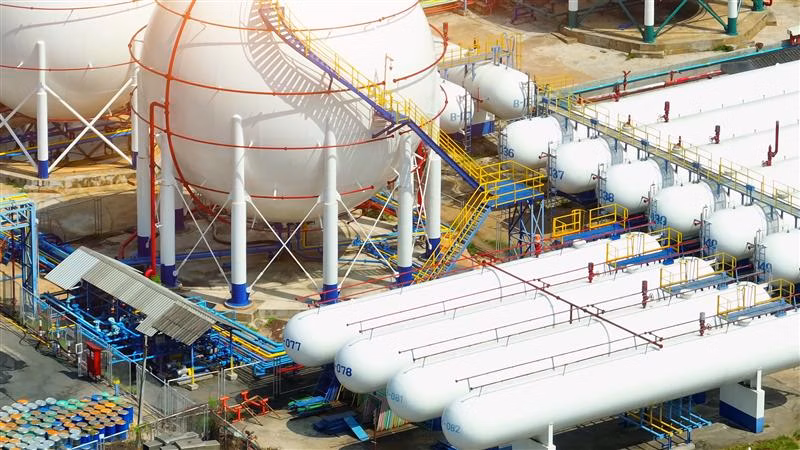
The Global LNG Capacity Tracker is a constantly updated database that displays global LNG export projects by country, size, timeline, and investment stage. It includes data on:

- Final investment decisions (FIDs)
- Construction progress
- Estimated completion dates
- Location and ownership of projects
This tool allows users to sort and analyze current and upcoming LNG projects, helping them stay informed on developments that could impact energy pricing, infrastructure, and security.
Why Is It Important?
The IEA expects nearly 290 billion cubic meters per year (bcm/year) of new LNG capacity to be added globally between 2025 and 2030. This is the largest supply surge ever seen in the LNG industry.
This kind of rapid growth will:
- Change the way countries secure energy
- Create new trade routes for LNG
- Shift pricing power from suppliers to buyers
- Increase competition between new and older facilities
Understanding this landscape is now essential for businesses, investors, and governments.
Countries Leading the Charge
Several regions are playing a key role in this wave of LNG expansion.
United States
The U.S. has taken the lead in approving and building new LNG facilities. After a short pause in 2024, the U.S. resumed approving major projects in 2025. New terminals in Louisiana and Texas are expected to start exports between 2025 and 2027. These include projects like:
- CP2 LNG
- Plaquemines LNG
- Port Arthur LNG
This U.S. growth alone could add over 100 bcm/year to the global total.
Qatar
Qatar, already one of the largest LNG exporters, is significantly expanding its North Field. This expansion will bring in more than 40 bcm/year of extra supply, most of it aimed at long-term buyers in Asia and Europe.
Russia, Canada, Mozambique
These countries have large LNG projects under construction, including:
- Arctic LNG 2 (Russia)
- Mozambique LNG
- LNG Canada
However, some of these projects face political or construction-related delays.
When Will This New Supply Arrive?
Based on current timelines, here’s how the new LNG capacity will ramp up:
- 2025: Around 30–35 bcm/year of new capacity
- 2026–2027: Peak growth years, with 65–75 bcm/year added annually
- 2028–2030: Growth slows but continues steadily
Most of the early capacity will come from U.S. and Qatari projects already under construction.
What This Means for Prices and Trade
With so much LNG coming online, the global supply of natural gas could exceed demand in the short term. This would lead to:
- Lower global prices
- Short-term oversupply
- Increased pressure on older LNG plants
For buyers, especially in Asia and Europe, this means more flexibility and possibly cheaper long-term contracts.
For producers, especially those operating older or smaller plants, this means greater competition. Some may struggle to stay profitable, while newer projects with low operating costs will have an edge.
Risks to Watch
Even with these optimistic numbers, there are still risks that could impact delivery and future growth.
Construction Delays
Some projects are in areas with tough weather conditions or limited infrastructure. Any delay in equipment, labor, or approvals can push back delivery dates by years.
Geopolitical Issues
Sanctions, wars, or internal instability could stall projects. For example, projects in Russia and parts of Africa are under pressure from geopolitical tensions.
Policy Shifts
Countries might change their strategies to reduce carbon emissions faster, reducing the long-term demand for natural gas. This could make some new LNG investments risky in the long run.
Financing and Costs
As construction costs rise globally, some projects may struggle to find the necessary funding or be canceled before they begin.
Regional Effects
Europe
Europe is likely to benefit the most in the short term. With reduced Russian pipeline supply, the continent has turned to LNG imports. More supply will increase energy security and reduce seasonal price spikes.
Asia
Asia remains the largest and fastest-growing LNG market. Countries like China, India, and Japan are building more LNG terminals to support industry and reduce coal use.
Emerging Markets
New LNG supply could help bring gas to new markets in Africa, Southeast Asia, and Latin America. However, financing infrastructure like import terminals remains a challenge in these regions.
How the Tracker Helps Stakeholders
The Global LNG Capacity Tracker is designed for use by many types of users, including:
Governments
To plan energy imports and security strategies
To balance climate targets with reliable fuel access
Energy Companies
To find the best regions for future investment
To predict competition and future supply timelines
Financial Institutions
To evaluate the risk and returns of investing in LNG projects
To support financing decisions for infrastructure development
Researchers and Analysts
To track long-term trends
To predict pricing and trade impacts
This level of transparency gives everyone—from policy leaders to investors—a real-time view of the LNG industry’s future.
What the Future Holds
The LNG industry is entering a new chapter. This wave of new supply will shape not just prices but also how countries plan their energy futures. Key developments to watch include:
- Whether demand rises quickly enough to match the surge in supply
- How much more capacity will be approved in 2026 and beyond
- Whether countries meet climate targets while still expanding gas use
With the Global LNG Capacity Tracker, the IEA has provided a powerful new tool to navigate this transition.
Conclusion
The launch of the Global LNG Capacity Tracker marks a major step forward in energy market transparency. By offering a clear view into the largest LNG supply boom in history, the tool will help shape how governments, companies, and investors prepare for the future.
As new export projects come online across the U.S., Qatar, Canada, and beyond, this tracker will serve as a roadmap for understanding global LNG flows, investment opportunities, and supply security.
In an industry where billions of dollars and national energy strategies are on the line, having accurate and timely data has never been more important. With this tool, the IEA is helping the world move toward a smarter, more secure energy future.
Do follow UAE Stories on Instagram
Read More: Global Air Cargo Surges: May Sees Surprise 4% Tonnage Rebound